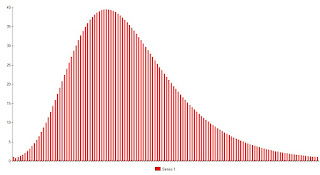
Figure 1
Figure 1 represents what the daily number of new cases as epidemic beings to peak. The numbers on the vertical axis are not representative of a specific population and simply reflect the fact that the simulation was started with an arbitrary daily new case/existing case ratio of approximately 0.24.
Figure 2 represents a complete epidemic starting with a single case. The total number of infections for this simulation is 14,832 and the duration is approximately 135 days. Again, this represents a hypothetical population.
Figure 2.
Here are the principles behind the model, and the observations used to make predictions:
I. Exponential growth.
The first quarter on the left hand side of the left hand side of the graph appears to represent an exponential function. These have the form N=N0*(A)t, where N0 is the initial number of cases, A is some constant and t is the amount of time (usually in days) that elapses for the time that the number of cases was N0. If the function is truly an exponential function then the rate of change of N is proportional to N. A is equal to 1+D/N where D is the number of new cases that occur during a day and N is the number of cases at the beginning of the day, or end of the previous day. If D/N were to stay constant, the number of cases would exhibit exponential growth, and soon, for a typical real-world ratio of D/N of about 0.2, the numbers would exceed the population of the earth in about 4 months.
II. Real world growth.
Obviously, the number of infected people has not approached the population of the world. The value of D/N can be computed daily, and for the outbreaks in various countries typically begins at a value of about 0.4, then declines. Typical values right now are about 0.16 for the United States, 0.6 for Italy, 0.14 for France, and about 0.09 for the part of the world that is bothering to keep statistics. Values typical at the beginning of an outbreak are about 0.4, drops fairly rapidly to around 0.28 then more gradually to 0.22 after three weeks or so. The ratio of D/N can be thought of as the ease with with the virus spreads. If the virus spreads easily, the number of new cases will grow faster and D/N will be high. The opposite is true when D/N is low. D/N is noted to progressively decrease. This is because the virus has increasing difficulty spreading, because the uninfected portion of the population is, on average less susceptible than those already infected, and because of efforts used to discourage the spread of the infection.
A model for the epidemic must account for declining D/N. The simplest way to do this is to assume that the number declines by a certain percentage each day. This is not rigorous, and there are more precise ways to do it, but for simple models it is adequate. If the number D/N were allowed to decay toward zero, the number of new cases per day would demonstrate a profile similar to Figure 3. The total number of cases would generate a sigmoidal curve shown in Figure 4.
Figure 3.
Figure 4.
This curve might allow for passable predictions. The graph above assumes an initial D/N of 0.4 and decays at the rate of 5% per day. This represents an optimistic increase in impairment to virus spread, and leaves out modeling crucial factors. Nonetheless, it does produce a reasonable shape for the the profile of new cases over time. At this point our model is N=N0*(1+(D0/N0)*ft)t, where D0/N0 is the initial ratio of daily new cases to existing cases and f is the daily factor representing the decay D/N decreases, in the example 0.95. A more precise method would be to record actual D/N values and fit a polynomial curve using regression techniques.
III. Active cases.
One of the factors omitted from the simple model above is that only a portion of cases are contagious others have died or their infections have resolved. We should then adjust the model by replacing N0 with each day's Na, i.e. active cases.
While D/N is a time dependent factor that decreases as a function of disease extent, and which can be intentionally modified with interventions such as social distancing, adjusting the profile of active cases is determined almost exclusively by properties of the virus and disease course. This fact is what makes disease limiting interventions work. It is the basis for estimating the time course of the disease and explains why the epidemic will die out long before everyone is infected. It also gives some insight into why a D/N of 0.4 may be the indicator of a resolving epidemic. This will be addressed in the next post.


No comments:
Post a Comment